Sidebar

Remember Me
  • Forgot your username?
  • Forgot your password?
auditBus auditBus auditBus
  •  
  • auditBus
    • International
    • Agile
    • Mobile
    • Efficient
    • Use case
    • Contact
  • Get started
    • Outline
    • Location
    • Questionnaire
    • User
    • Layer
    • Roll out
      • User administration
      • Project status
    • Collect data
      • Online
      • Offline
    • Evaluation
      • Key figures
      • Report
  • Help
    • Support-Center
    • Documents

Evaluation

Details
Introduction

Beyond gathering, a template is shared basis of evaluations. All parameters, needed for reports, key-figures and Presentation are part of it. How subsets get evaluated and become comparable, is determined by the amount and structure of the content layers, being created.

Core all over key figures are averages, calculated from the maximum of points, divided by the point that got reached per assessment in consideration of inapplicable questions. 


Retrievable at any time: auditBus statistics and evaluations

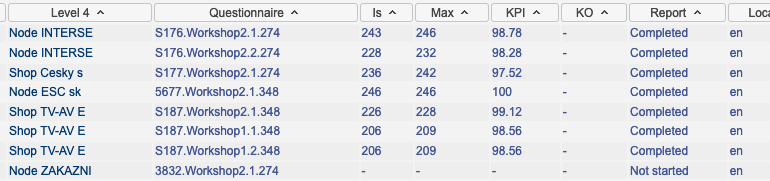
Retrieve intermediate results, including current key figures, amounts and current state of assessments and benchmarks including the completed assessments per template, dynamically calculated by selecting any of the evaluation functions.


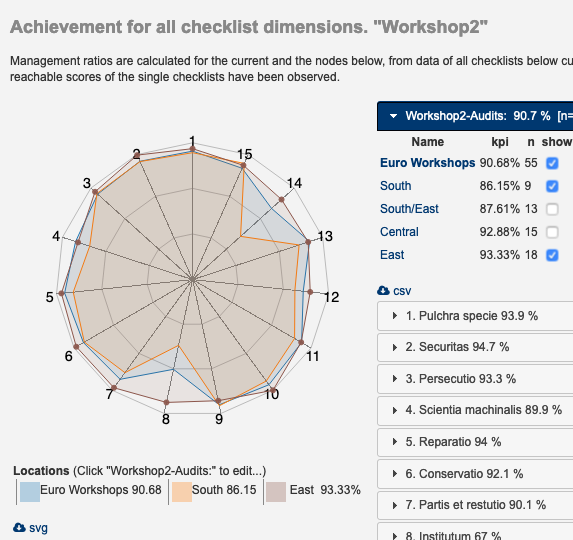
Identify problem areas

Just pick one specific section to dive into detailed analysis of the selected assessment. Key figures show attainments for each tested standard regarding the currently selected content layer. Barcharts facilitate identification of insufficient results at first sight.
All Charts and Tables can easily be downloaded as .svg or .csv data.


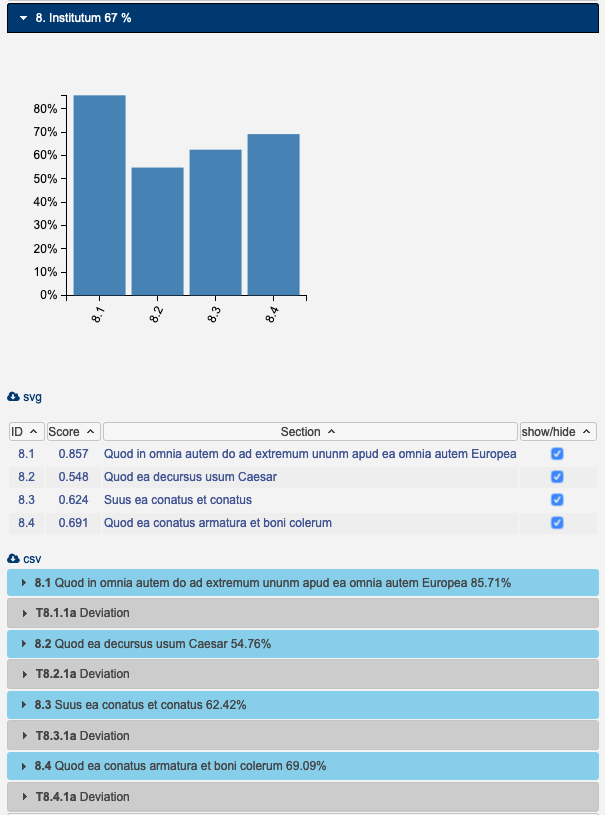
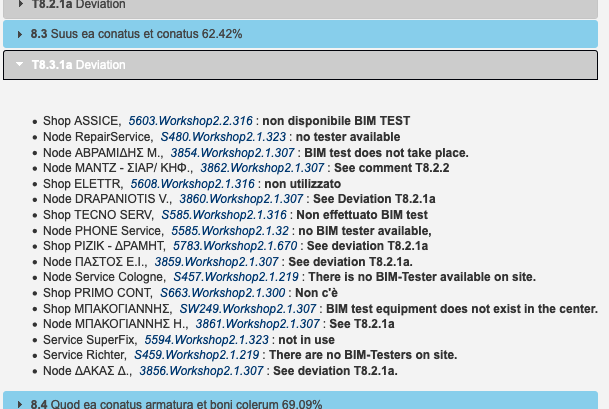
If your template supports mandatory deviation capturing, you will be able to analyse causes of each single task and follow implementations. Deviations are directly linked to related assessments.


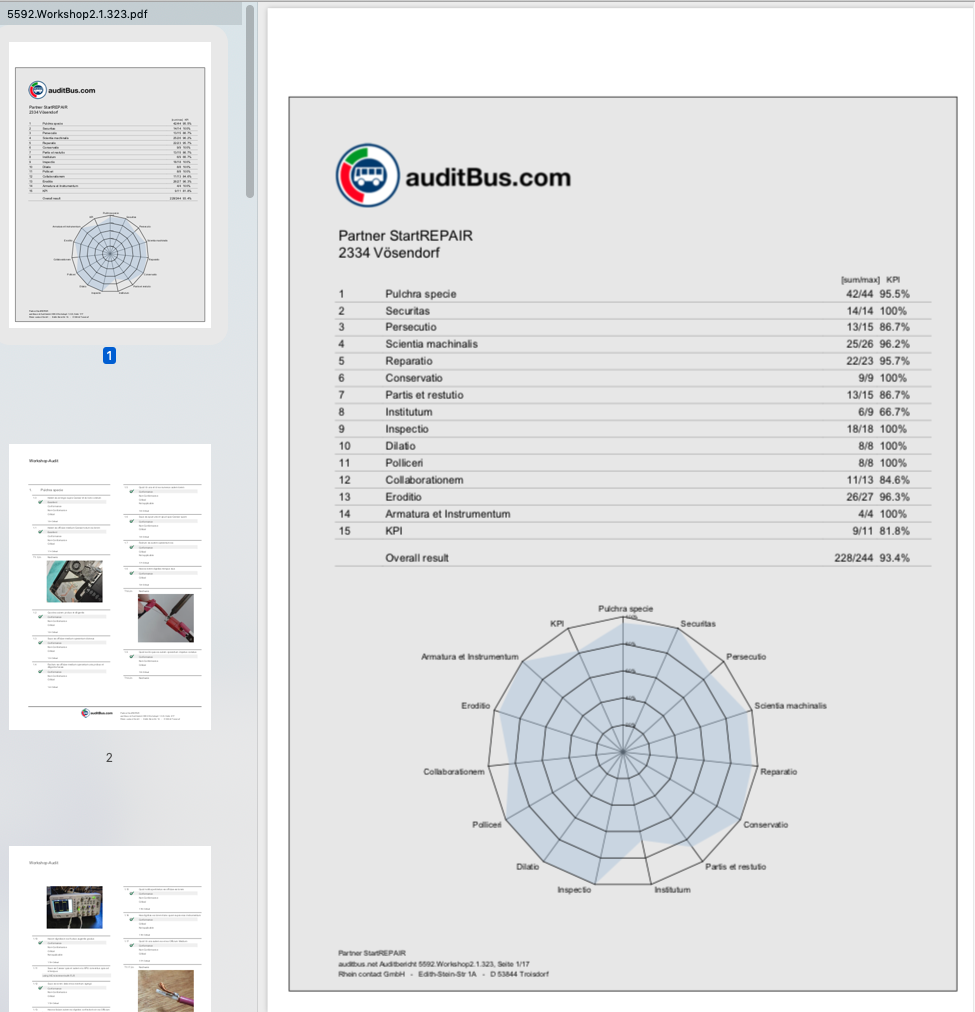
Download charts and tables for individual purposes

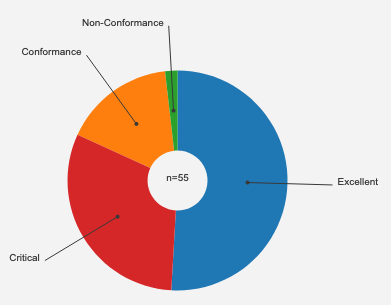
Possibility to download single charts might be useful to enrich individual presentations. Beyond radar and bar charts visualising key figures, auditBus provides statistical counting of all options per question, accepting results of completed audits of the selected content layer.


Key figures

Details
Introduction

Calculate key indicators including not applicable questions


Almost ever, some questions are "not applicable", facing the specific nature of a situation. In this situation, people often treat not applicable questions like conformities in order to preserve weighting with regard to the total points or just out of ignorance. We don't believe this is the best way to deal with not applicable questions.

Quality of any product, process or service has to be assessed taking its complexity into account, which is reflected by the  amount of questions dedicated to it. If multiple processes are checked with one questionnaire, processes not taking place should rather be completely removed, than rewarded as if fully successful. Otherwise, worst case some site not providing any service would be rated better than sites with a wide range of services and having just one or two errors.

auditBus therefore works with dynamical Scoring. For each assessment auditBus calculates the maximum points, based on the number of questions effectively applied.


Report

Details
Introduction

Of course auditBus creates a complete and optimized documentation for each assessment as PDF-File. The standard-report includes all questions, answers, comments, evidences and images or attachments.

The report's cover shows key figures and results for each result - as table or radar-chart for example.

Each report is created automatically on closure of the assessment and after completion of the assessment. At the same time, the input form is replaced by a link to the PDF File.


Of course, layout of standard reports can be replaced by alternative, fully customized Layouts.


Contentlayer

Details
Introduction

Every auditBus content is layered.

Each layer represents at least one location and each site, can have subordinated sites. Individually or grouped by other layers. The shape of the branches is neither determined, nor uniformly and follows the hierarchical structure of a given organisation.

Access to any content is organised ba access to specific layers.

  • Questionnaires are accessible, by assignment to a specific layer and give users access to it. Rights to access automatically include subordinated items.
  • Users get access by adding layers to their account.
  • By selection of a specific layer, evaluations, counts, key figures and banchmarks for the selected node are calculated.


All data is with reference to the selected layer respectively node. Comparision of different subsets is achieved by switching between layers.


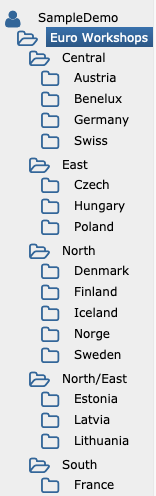
New layers and sites will always be added to the currently selected node. For example, to add a new location to "Germany" like shown on the left, select  "Germany" first, and "add Location" next.

Shape of Branches can be edited any time by drag and drop. In order to split "Central" into "Central-South" and "Central-North" for example, add both new layers to the folder "Central" and then move "Austria" to "Central-South" and "Germany" to "Central-North".

This way to cluster data is a comfortable method to organize user rights by competence and grants highest flexibility for reporting.

Page 2 of 2
  • Start
  • Prev
  • 1
  • 2
  • Next
  • End
auditBus.net CMS
easy & agile auditing
Privacy Policy
Imprint
  • English (United Kingdom)
  • German (DE)
 
 
Copyright © 2025 auditBus. All Rights Reserved. Designed by JoomlArt.com. Joomla! is Free Software released under the GNU General Public License.
Bootstrap is a front-end framework of Twitter, Inc. Code licensed under MIT License. Font Awesome font licensed under SIL OFL 1.1.
Powered by T3 Framework